import numpy as np
import matplotlib.pyplot as plt
plt.style.use('fivethirtyeight')
from numpy.random import default_rng
Creating a quadratic fit on random data#
In this notebook, you will
build a variable of fabricated falling heights,
y= \(\frac{g}{2}t^2 + error\)find the best-fit quadratic function with
np.polyfitplot the data and fit using
poly1d
rng = default_rng()
x = np.linspace(0,5)
y = 9.81/2*x**2 + (rng.random(len(x)) - 0.5)*4

plt.plot(x, y)
[<matplotlib.lines.Line2D at 0x7f7af955d0d0>]
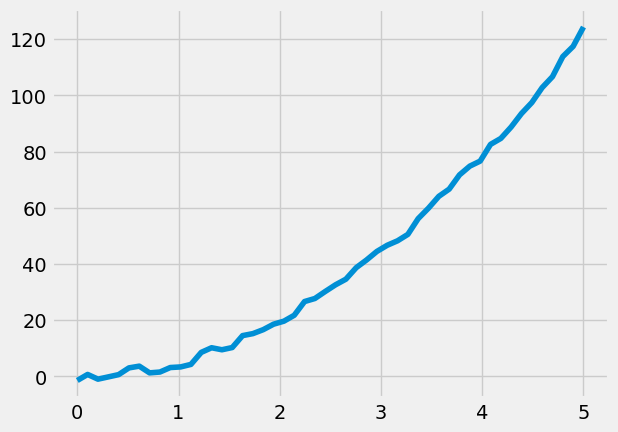
Above, the fabricated falling data is shown for 5 seconds. The error is introduced as uniformly random numbers from -2 - 2 as (rng.random(len(x) - 0.5)*4.
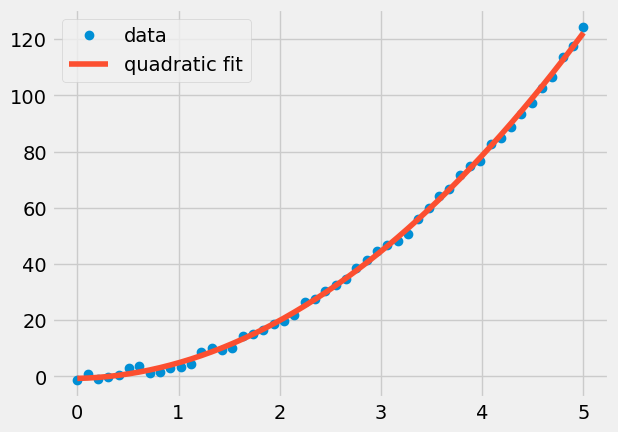
Next, you build the polynomial fit with np.polyfit. Finally, plug the polynomial constants into the np.poly1d function to created a function for \(y_{fit}(x)\) = pp(x).
A = np.polyfit(x, y, 2)
pp = np.poly1d(A)
plt.plot(x, y,'o', label = 'data')
plt.plot(x, pp(x), label = 'quadratic fit')
plt.legend();