
import numpy as np
import matplotlib.pyplot as plt
plt.style.use('fivethirtyeight')

from numpy.random import default_rng
rng = default_rng()
HW_04 - Exercise: failure prediction#
In the dropping keys experiment, we ended the trials when the virtual person succeeded in entering the room. What would this look like if an engineering process failed when a certain device is used?
Consider a manufacturing plant that produces uses O-rings in the assembly. The O-rings are the weakest link in the design. Your company needs to use 10 O-rings in every device you manufacture. If one O-ring fails, the whole device fails. Your quality control team knows the O-rings fail 1-out-of-10 times. When you test a device, if it fails the rings are discarded and ten more used to assemble the device.
Your manager wants you to come up with a process to assemble these parts. The manager thinks that each part will need to be reassembled 10% of the time, regardless of the number of times its failed. See if you can recommend a process that makes use of this new knowledge that repeated assemblies have a decreased chance of failure.
N = 10000
cases = np.zeros(N)
keys = np.arange(10)
for ncase in range(N):
tries = 0
key = 10
while key != 0:
key = rng.integers(len(keys), size = 1)
tries += 1
cases[ncase] = tries
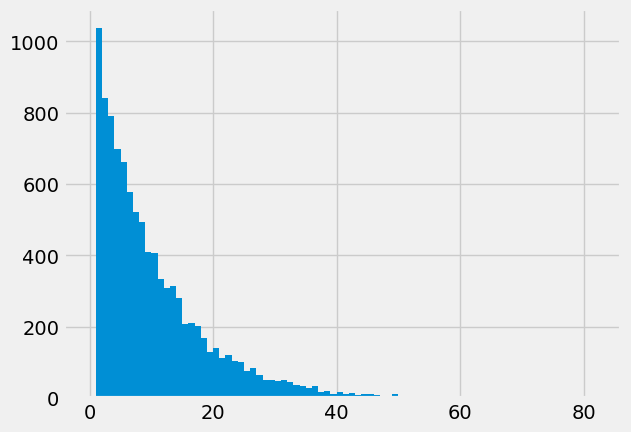
plt.hist(cases, bins = np.arange(np.max(cases)))
(array([0.000e+00, 1.038e+03, 8.400e+02, 7.910e+02, 6.980e+02, 6.610e+02,
        5.790e+02, 5.220e+02, 4.940e+02, 4.110e+02, 4.070e+02, 3.350e+02,
        3.090e+02, 3.150e+02, 2.820e+02, 2.090e+02, 2.100e+02, 2.030e+02,
        1.680e+02, 1.300e+02, 1.400e+02, 1.120e+02, 1.200e+02, 1.050e+02,
        1.010e+02, 7.600e+01, 8.400e+01, 6.400e+01, 5.100e+01, 5.000e+01,
        4.900e+01, 5.200e+01, 4.500e+01, 3.800e+01, 3.300e+01, 2.800e+01,
        3.300e+01, 1.700e+01, 2.100e+01, 1.300e+01, 1.800e+01, 1.100e+01,
        1.500e+01, 1.000e+01, 1.200e+01, 1.200e+01, 9.000e+00, 5.000e+00,
        5.000e+00, 1.100e+01, 6.000e+00, 7.000e+00, 2.000e+00, 2.000e+00,
        4.000e+00, 5.000e+00, 4.000e+00, 4.000e+00, 2.000e+00, 3.000e+00,
        2.000e+00, 1.000e+00, 2.000e+00, 3.000e+00, 3.000e+00, 2.000e+00,
        0.000e+00, 0.000e+00, 0.000e+00, 1.000e+00, 0.000e+00, 0.000e+00,
        0.000e+00, 0.000e+00, 1.000e+00, 1.000e+00, 0.000e+00, 0.000e+00,
        0.000e+00, 0.000e+00, 0.000e+00, 2.000e+00]),
 array([ 0.,  1.,  2.,  3.,  4.,  5.,  6.,  7.,  8.,  9., 10., 11., 12.,
        13., 14., 15., 16., 17., 18., 19., 20., 21., 22., 23., 24., 25.,
        26., 27., 28., 29., 30., 31., 32., 33., 34., 35., 36., 37., 38.,
        39., 40., 41., 42., 43., 44., 45., 46., 47., 48., 49., 50., 51.,
        52., 53., 54., 55., 56., 57., 58., 59., 60., 61., 62., 63., 64.,
        65., 66., 67., 68., 69., 70., 71., 72., 73., 74., 75., 76., 77.,
        78., 79., 80., 81., 82.]),
 <BarContainer object of 82 artists>)
try_01 = np.sum(cases == 1)/N
try_02 = np.sum(cases == 2)/N
try_03 = np.sum(cases == 3)/N
try_04 = np.sum(cases == 4)/N

print('failure on try 1: {}, {:1.2f}%'.format(try_01*N, 100*try_01))

print('failure on try 2: {}, {:1.2f}%'.format(try_02*N, 100*try_02))

print('failure on try 3: {}, {:1.2f}%'.format(try_03*N, 100*try_03))

print('failure on try 4: {}, {:1.2f}%'.format(try_04*N, 100*try_04))
failure on try 1: 1038.0, 10.38%
failure on try 2: 840.0, 8.40%
failure on try 3: 791.0, 7.91%
failure on try 4: 698.0, 6.98%
1/10*9/10*9/10*9/10
0.07289999999999999