
import numpy as np
import matplotlib.pyplot as plt
import scipy.stats as stats
plt.style.use('fivethirtyeight')

from numpy.random import default_rng
HW_02#
Calculating and reporting \(\pi\)#
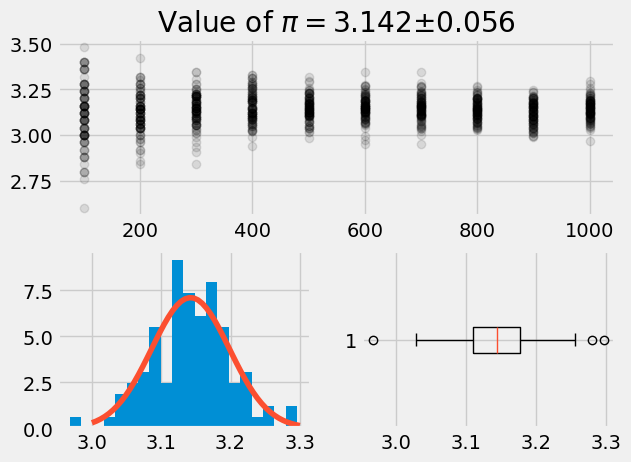
Calculate your own value of \(\pi\) using the random x- and y-coordinates. You need to report your findings to other engineers in your field. You should explain why and how you are calculating \(\pi\), then describe the data with at least one plot. You can use more if it helps to explain the process or a point you are trying to make, here are some examples from our first \(\pi\) calculation.
rng = default_rng(42)
plt.figure()

ax1 = plt.subplot(2, 2, (1, 2))
for N in range(100,1001, 100):
    trials = 100
    pi_trial = np.zeros(trials)
    for i in range(trials):
        x = rng.random(N)
        y = rng.random(N)

        r = x**2 + y**2

        pi_trial[i] = np.sum(r < 1**2)/N*4

    mean_pi = np.mean(pi_trial)
    std_pi = np.std(pi_trial)

    ax1.plot(N*np.ones(trials), pi_trial, 'ko', alpha = 0.1)
plt.title(r'Value of $\pi=${:1.3f}$\pm${:1.3f}'.format(mean_pi, std_pi));
ax2 = plt.subplot(2, 2, 3)
ax2.hist(pi_trial, 20, density=True)


x = np.linspace(3, 3.3)
pi_pdf = stats.norm.pdf(x, loc = mean_pi, scale = std_pi)
ax2.plot(x, pi_pdf)

ax3 = plt.subplot(2, 2, 4)
ax3.boxplot(pi_trial, vert=False);
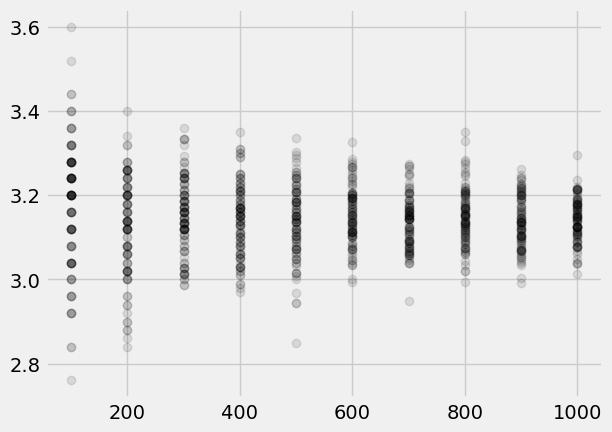
ax1 = plt.subplot(1, 1, 1)
for N in range(100,1001, 100):
    trials = 100
    pi_trial = np.zeros(trials)
    for i in range(trials):
        x = rng.random(N)
        y = rng.random(N)

        r = x**2 + y**2

        pi_trial[i] = np.sum(r < 1**2)/N*4

    mean_pi = np.mean(pi_trial)
    std_pi = np.std(pi_trial)
    plt.plot(N*np.ones(trials), pi_trial, 'ko', alpha = 0.1)
Some points to consider in your report#
\(\pi\) is not a random variable, but the probability that you land in a circle vs a square if your coordinates are x = 0-r and y = 0-r is \(\frac{A_{circle}}{A_{square}} = \frac{\pi r^2}{4r^2} = \frac{\pi}{4}\).
When is the mean “close enough” to \(\pi\)?
What do the tails of the calculated \(\pi\) values tell us about the prediction?
What else do you notice in your analysis?